Weather or climate? Differentiating the two can be confusing. Climate is the long term average of the weather over the years. This is a great explanation by Neil De Grasse Tyson. Today the weather may be warm and dry where you live; tomorrow it might rain- that’s weather. Thinking of the U.S. as a whole, we know the south generally has warmer weather than in the northeast and Alaska – that’s climate.
Long-Term Perspective Matters Most
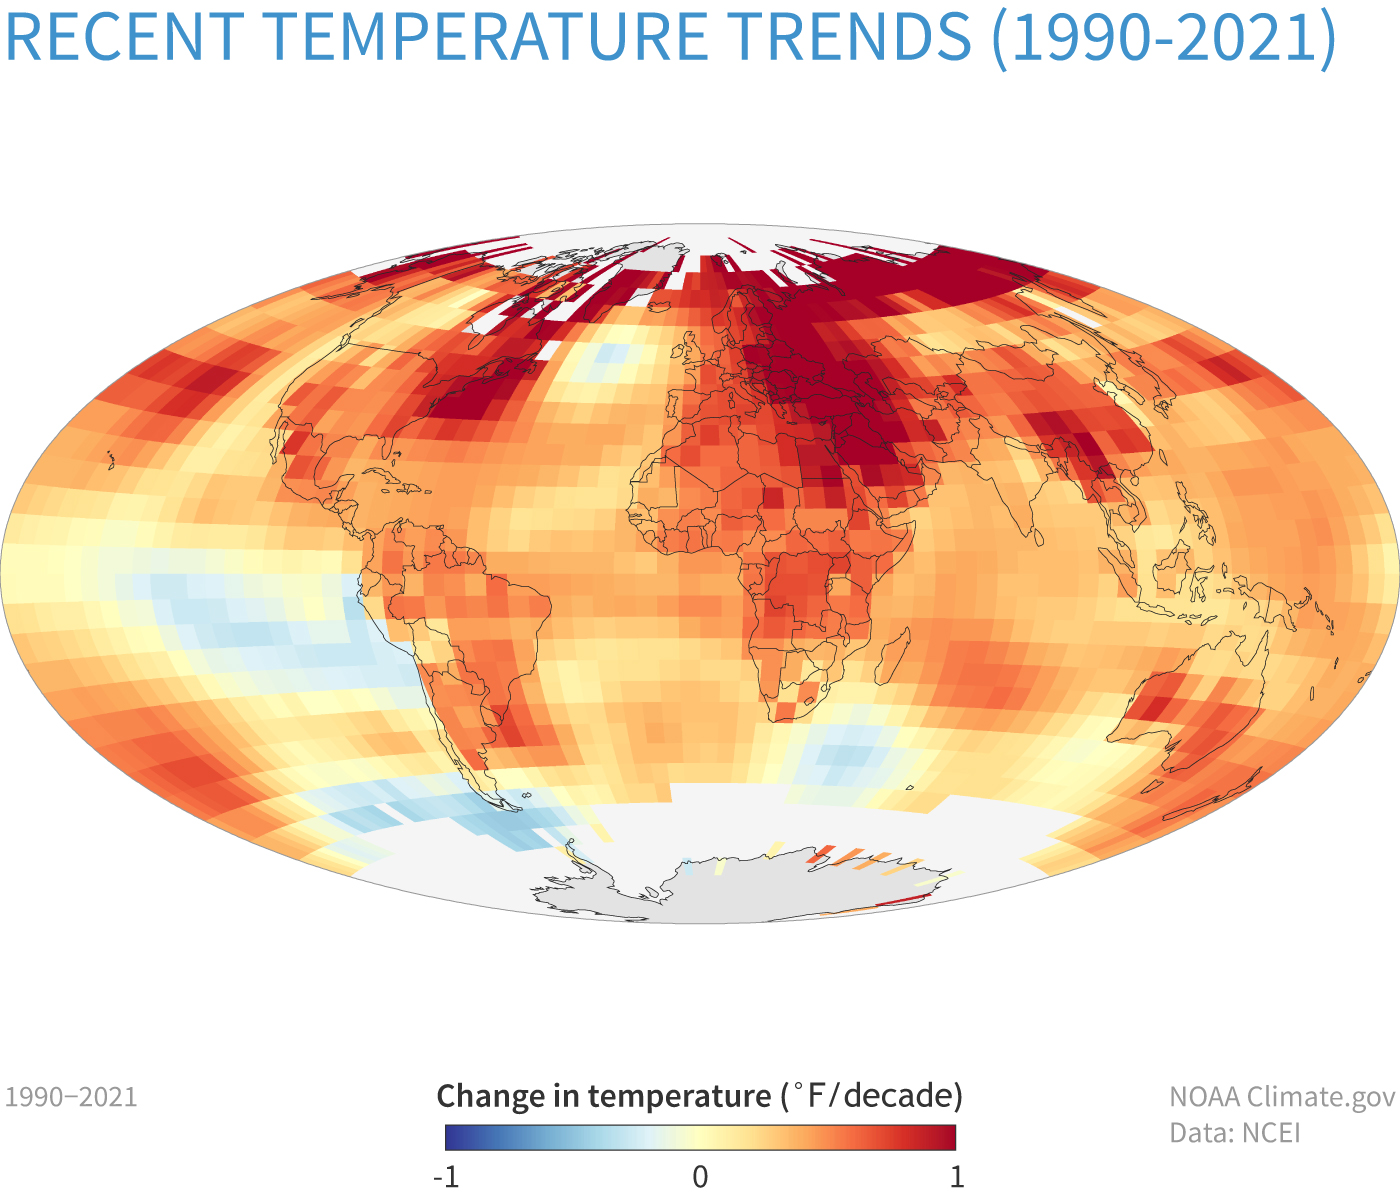
It’s the long-term average of the entire planet that really matters when we talk about the changes in the weather due to climate change. Today the planet is “running a fever” as Dr. Katherine Hayhoe explains. Over the second half of the 20th and the first decades of the 21st centuries the climate has warmed steadily. Nineteen of the hottest years have occurred since 2000, with the exception of 1998. The year 2020 tied with 2016 for the hottest year on record since recordkeeping began in 1880. The summer of 2022 has set heat records, and in the future some place some places may become too hot to live in.
Extreme weather events are increasing. The warming of the earth’s climate means more intense weather. In a study released in March 2020, Stanford researchers found that climate change is intensifying heat waves and heavy rainfall events faster than scientists had predicted.
The decade 2010-2019 saw so much damage from extreme weather events in the U.S. that 258 of them reached one billion dollars in costs. And, in every year between 2015-2019, ten or more separate billion-dollar disaster events impacted the U.S. If you want to see where extreme weather events that can be attributed to climate change occurred around the globe, this interactive map shows you.
Those events include: extreme heat, drought, more intense storms, and wildfires. The 2021 IPCC Report in the Physical Science basis of climate change says: “Human-induced climate change is already affecting many weather and climate extremes in every region across the globe. Evidence of observed changes in extremes such as heatwaves, heavy precipitation, droughts, and tropical cyclones, and, in particular, their attribution to human influence, has strengthened” since the last report.
Heatwaves
In the past It has been challenging for scientists to say definitively that climate change has caused a specific extreme weather event. But now researchers say they can make a direct link between climate change and heat waves. Analyzing the devastating hot weather that hit the Pacific Northwest in 2021, scientists can say that the heat wave “was virtually impossible without climate change.”
In the summer of 2022, climate scientists’ analyses “have already demonstrated that the human effect on the climate greatly increased the likelihood of the extreme hear in India and Pakistan in May and the record high UK temperatures in July.”
Wetter or Drier?
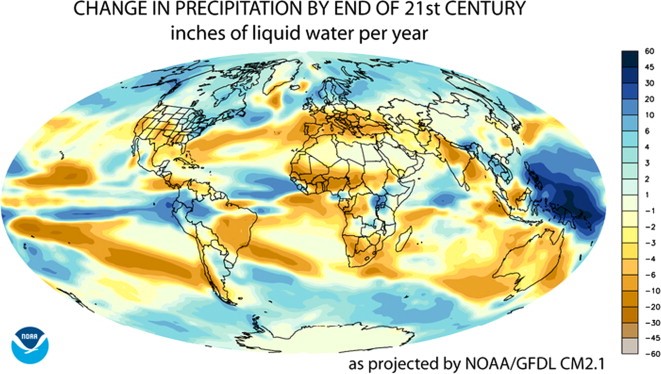
As the map below shows, some parts of the world will have a wetter climate, some a drier one by the end of the century if emissions aren’t reduced.
Climate scientists know that as global temperatures rise, the intensity of storms increases — they become wetter. In July 2022 powerful storms triggered flash floods across the U.S., flooding homes and killing people in Kentucky, inundating neighborhoods in St. Louis and the Las Vegas strip. In late summer of 2022, Pakistan experienced extreme flooding. In early September nearly one third of the country was underwater after about eight weeks of heavy monsoonal rains.
These storms are part of an intensifying water cycle, according to scientists: An intensifying water cycle means that both wet and dry extremes and the general variability of the water cycle will increase, although not uniformly around the globe.”
The changes in the water cycle include drying— droughts— which we’ve seen in the Mediterranean, southwestern Australia, southwestern South America, South Africa, and western North America. Climate change increases the frequency, duration and intensity of droughts in regions prone to them.
Climate creates droughts in several ways: warmer temperatures enhance evaporation, reducing any surface water and drying out soils and vegetation. This makes periods with low precipitation drier than they would be in cooler conditions. And it’s also causing less precipitation to fall in some regions and decreasing snowpack and changing the timing of water availability.
Wildfires
There were big devasting wildfires in Australia in December-February 2019/2020, and the country has seen a long-term increase in the risk of fires and a lengthening bushfire season due to climate change. Drought and more extreme heat waves have created ideal conditions for bushfires. Climate modelers confirmed that, “Climate change played a major role, making the hazardous conditions that led to Australia’s monstrous blazes at least 30 percent more likely than they would have been without human-caused global warming.” Read our blog about the fires.
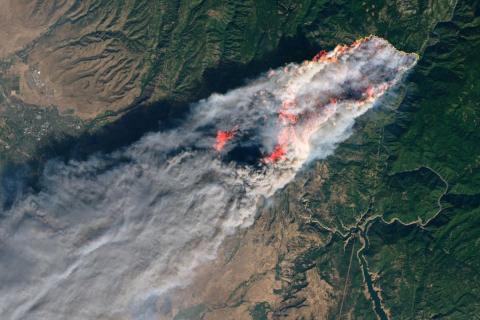
Devastating wildfires are occurring in other places: in California, where we live, wildfires have increased in frequency and severity. California’s wildfire activity has increased for five decades with five of the state’s largest fires occurring since 2006. Researchers found that climate change is the leading driver of that increase. Dr. Michael Mann explains the connection between wildfires, and climate change.
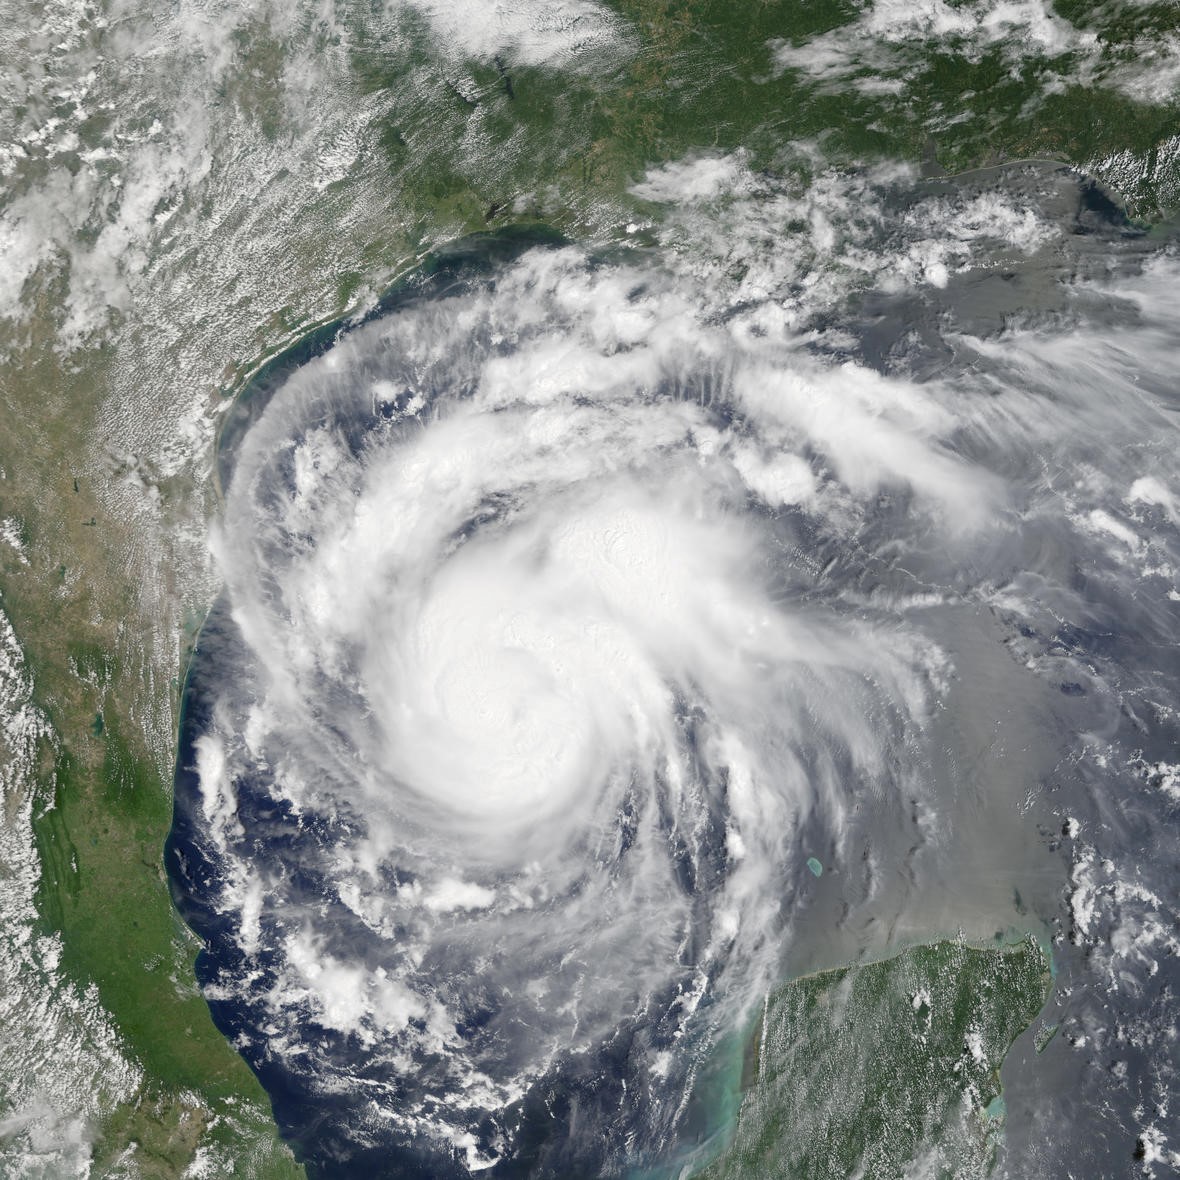
Hurricanes
It’s not only wildfires that have caused more destruction, it’s also hurricanes. Climate change is making hurricanes more dangerous with increased rain and storm surge height, and increased wind speeds. A new study found that Hurricane Florence (2018) delivered more precipitation and was spatially larger definitely due to climate change. The increase in precipitation hurricanes deliver is due to the combination of warmer air over warmer ocean water where the hurricanes form and grow. In 2017 Hurricane Harvey dumped a “biblical” 60 inches of rain on southeast Texas. Scientists say: “Climate change has not been directly linked to the frequency of named tropical storms, but it has been linked to an increase in the intensity of storms.”